#条形图、折线图、散点图、face_wrap()
ggplot() + geom_bar() # geom_line,point,geom_area
# eg
library(ggplot2)
library(gcookbook)
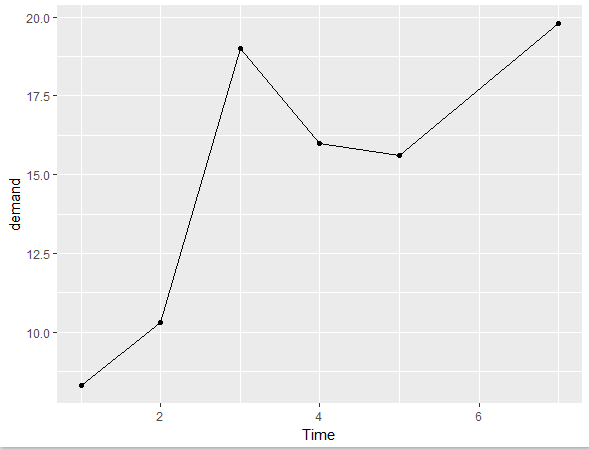
ggplot(BOD) + geom_line(aes(x=Time,y=demand)) + geom_point(aes(x=Time,y=demand))
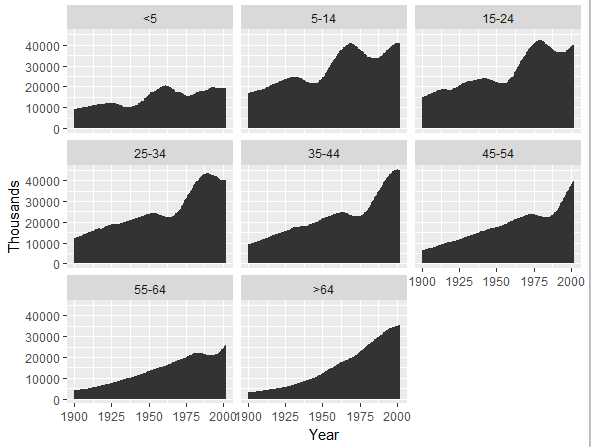
us <- uspopage
ggplot(us)+geom_area(aes(x=Year,y=Thousands))+facet_wrap(~AgeGroup)
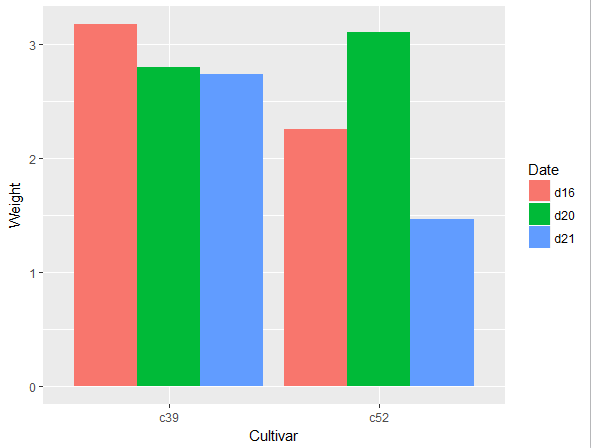
ggplot(cabbage_exp) + geom_bar(aes(x=Cultivar,y=Weight,fill=Date),stat='identity',position = "dodge")
library(ggplot2)
library(gcookbook)
diamonds <- diamonds
set.seed(100)
diamonds <-diamonds[sample(nrow(diamonds),1000),]
summary(diamonds)
str(diamonds)
head(diamonds)
#names(diamonds)
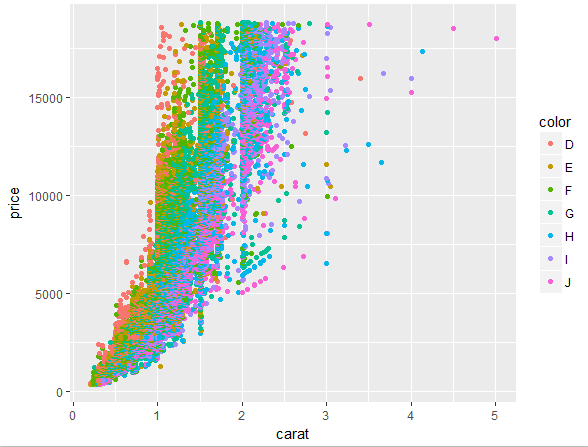
#价格和克拉的关系
ggplot(diamonds)+geom_point(aes(x=carat,y=price,color=color))
#价格分布
ggplot(diamonds)+geom_histogram(aes(x=price,fill=cut),position="dodge")
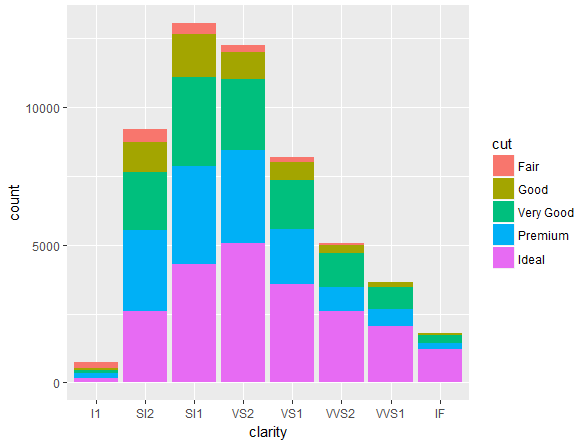
#透明度分布
ggplot(diamonds)+geom_bar(aes(x=clarity,fill=cut))
#价格概率分布
ggplot(diamonds)+geom_density(aes(x=price,color=cut))
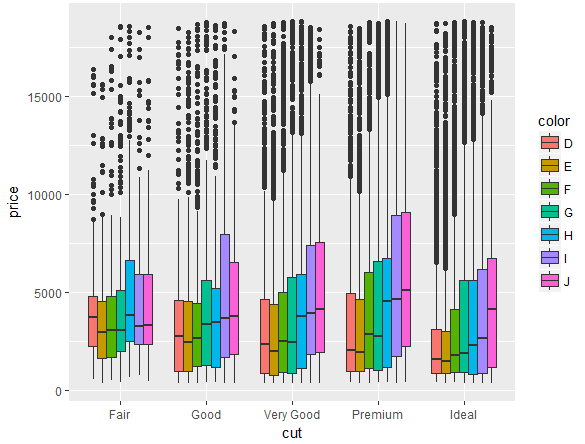
#不同切工下的价格分布
ggplot(diamonds)+geom_boxplot(aes(x=cut,y=price,fill=color))
#坐标变换
ggplot(diamonds)+geom_point(aes(x=carat,y=price,color=color,shape=cut))+scale_y_log10()+labs(x='克拉',y='价格',title='中文标题')